A canvas window
It is called a canvas because plots entered upon it can be moved around and resized, just like graphic objects in a typical drawing program. The canvas can be extended over multiple pages. The canvas and all its items can be saved to a document file and previously saved documents can be open at a later date. The document file format is XML .
The document files never save any DataSource objects used by the canvas items, rather a reference to the NTuple file is saved as a relative path. If the data in the NTuple file has changed since the document was saved, then when the document is opened, the plots display the NTuple's new data.
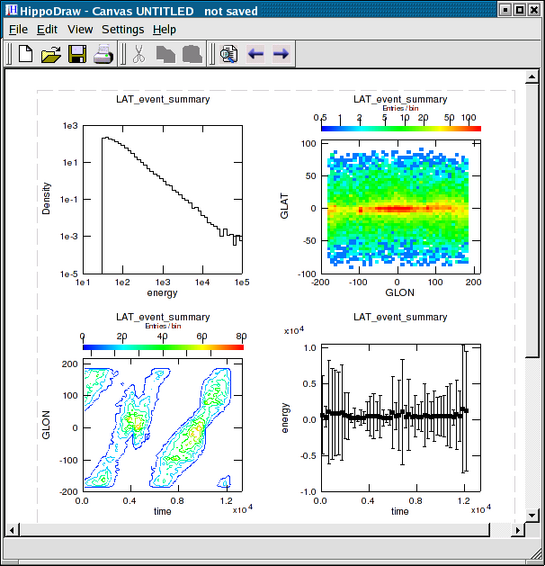
The CanvasWindow looks like this ...
A canvas window
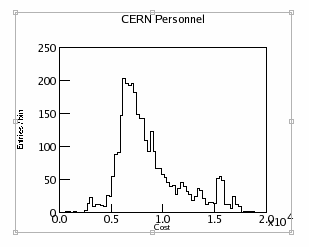
A canvas item in selected state
The canvas item shows it is selected by having a light gray rectangle around it. Note the knobs on the rectangle. One can click and drag on these to resize the item. To move the item, click and drag on the item but away from the knobs. Multiple items can be selected by doing a shift-click. When multiple data representations are on the same plot, then control-click is used to select among them.
Holding down the right mouse button turns the mouse cursor into a set of cross hairs. Also the data coordinate of the position of the cross hairs is shown in the canvas window status bar. This is illustrated below.
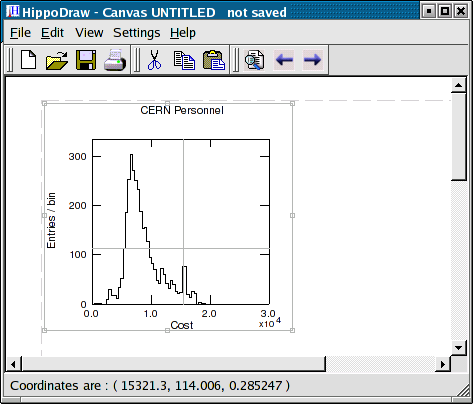
Canvas window with right mouse down
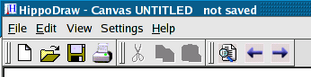
Detail of menu bar and tool bar
The tool bar icon are convenient shortcuts to a control, but it is not always obvious from the icon what the control action will be. To verify what the icon does, hold the mouse cursor over the icon for a few seconds. A tool tip will appear describing the control. Also the keyboard short cut, if any, will be display in the tool tip and the canvas window status bar.
Like tool bars in most applications, the tool bar can be moved to either side or the bottom of the CanvasWindow. To do so, click and drag on the vertical handle, which is at the extreme left in the illustration above.
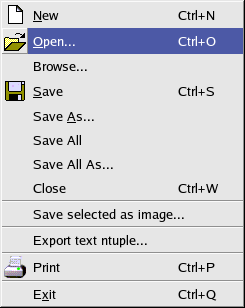
File menu
The actions of most of the menu items is pretty obvious. The icon used by the tool bar control is shown alongside the menu item along with its keyboard shortcut, if any.
The first two items creates a new canvas window, opens and existing one. The Browse... item opens an existing canvas in browse mode. That is, the canvas is off screen and plot selection dialog is displayed. By choosing a display from this dialog, one can make a copy of the display to the canvas window.
The @ b Save item is used to save the current canvas to a file. The Save As... menu items allows one to save the current canvas to a different file. By default the suffix .hpo is used for canvas document files. If the canvas is a new one and has not yet been saved to a file, than the menu items Save and Save As... are equivalent.
The Open menu item also allows one to open a file of different types. The default is a HippoDraw document file that was previously saved. By using the File type control, one can also open a data source file. Under UNIX-like systems, one can use the mouse wheel to scroll through the options. This doesn't work under Windows because the Windows native file dialog is used and it doesn't support it.
Data sources in HippoDraw's native form (ASCII file format for NTuple) is always available. ROOT ntuple like files (.root) and FITS files (.fits) are also available if HippoDraw was configured with those options. The example below shows the file dialog for opening a ROOT ntuple file.
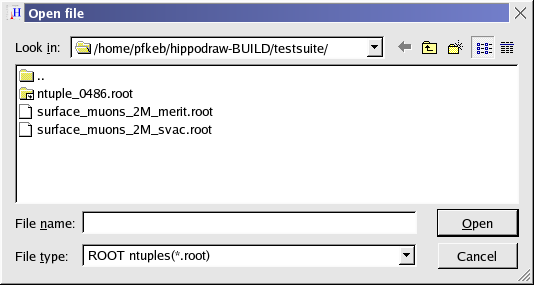
File dialog window.
By using the File type: combo box, one selects the type of file to open. As shown above, one is selecting a ROOT file that is in the form of an NTuple. See RootNTuple class for description of what ROOT files are supported. Other supported format are FITS tables and HippoDraw's ASCII text file, see ASCII file format for NTuple for details.
The last available selection in the File type: combo box is all files. When this is selected, the HippoDraw tries to open the file with specific formats, like FITS, and it fails, tries plain text tuple. If it fails, then an error dialog is raised.
The Save All menu item saves the canvas and any DataSource objects that were created in memory and not yet saved to a file. The Ntuple is saved is the same directory as the canvas and given a file name the same as the canvas document with integer index appended, but with the suffix .tnt. Thus if the document file name is foo.hpo, then the first NTuple file name will be foo0.tnt. The menu item Save All As... allows one to save the document and its NTuple objects to a different filename and the Save All is equivalent to it if the document has not yet been saved.
The Close menu items closes the current canvas window. If changes have been made to it, the users is prompted to save them, discard the document, or canceling the action. If only one canvas window is active, then closing it will also terminate the application.
The Save selected as image.. menu item saves one or more selected canvas items to an image file. The image format is chosen by the file type selected. At least 9 formats are available including the popular EPS, JPEG, and PNG formats. GIF format is also available if HippoDraw was built with a Qt library configured to support GIF.
If more than one canvas item is selected, the image file will be the size of the rectangle enclosing all the selected canvas items. Their relative positions are conserved in the image file.
The Export text ntuple.. menu item allows you to save a NTuple to a file in the ASCII file format supported by HippoDraw. See ASCII file format for NTuple for details.
The Print menu items prints the canvas. A print dialog is first presented with the standard options of choosing a printer or creating a Postscript file.
The Exit menu item terminated the application. If there are any modified and unsaved canvases, the user is prompted to save or discard those changes.
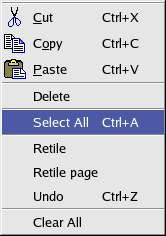
Edit menu
The actions of most of the menu items is pretty obvious. The icon used by the tool bar control is show alongside the menu item along with its keyboard shortcut, if any.
The Cut, Copy, and Paste menu items have actions like most applications today and use the standard set of keyboard short cuts. Cut first makes a copy of the selected items to HippoDraw's pasteboard then removes the items from the canvas. Copy makes a copy of the selected items to HippoDraw's pasteboard. Paste copies the items on HippoDraw's pasteboard to the canvas. If an item is selected on the canvas, the pasting is done near it. The Delete menu item is like Cut except that a copy is not made to the pasteboard.
By default, items are inserted in the canvas, either from the Inspector Users Guide or by one of the Python extension module, on a grid. The size of the items is such that two items horizontally and three items vertical fit the selected paper size without falling on the page break. The user can resize and move the items around after they are inserted. Sometimes, he make a mess. The Retile menu item will move and resize all canvas items so that the default grid is re-established while the Retile page will re-tile only the current page.
The Clear All removes all items from the canvas. Since this operation can not be un-done, the user is prompted to acknowledge he wants this action.
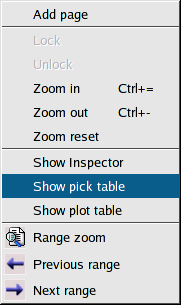
View menu
By the default, pages are added to the canvas automatically as new canvas items are inserted. The Add page allows the user to manually add a page.
The Zoom in and Zoom out menu items enlarge and un-enlarge the canvas. Zooming in might be useful for viewing details without resizing the item. Zooming out allows one to see more plots as thumbnails without resizing all the items.
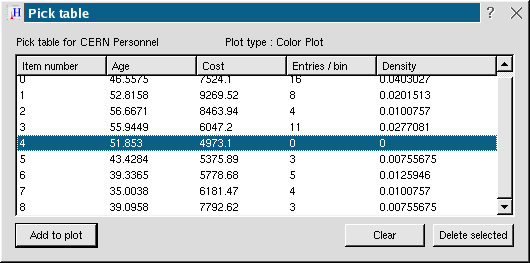
The pick table
With the pick table visible, one can right click with the mouse to pick a point on the selected plot. Upon release of the right mouse button, the X, Y, and Z, if applicable, point is added to the table along with pick number. An NTuple is also created in memory with the contents of the pick table. It can be used to create other plots. The Add to plot button adds a ScatterPlot data representation to the selected plot which displays the contents of the NTuple. As additional picks are made, the NTuple is updated, along with any plots bound to that NTuple. The table may be sorted by any column by clicking on labels at the top of the pick list. The first click on a column label sorts that column in ascending order. The second click on the same column changed the sorting order to descending. Further clicks toggle the sorting order. The NTuple is also sorted. and the pick table always represents the current contents of the NTuple.
The Show plot table opens a window with a table of all the items on the canvas. The table looks like this.
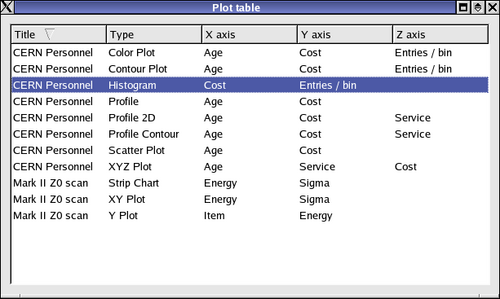
The plot table
The items' title, data representation type, the binding to the X and Y axes, and optionally the Z axis is shown. One can sort any column by clicking the the column's label. Clicking on an entry in the table will select that item on the canvas.
The next three items control the range of data being displayed on the selected plot. The Range zoom toggles the range zoom mode. When in the mode, one can select a rectangle with the left mouse button For 2D plots, such as a histogram, the range of the X axis will change to be the size of the width of the rectangle. For 3D plots, such as a contour plot, both the X and Y axis will be changed to the size of the rectangle. When not in range zoom mode, the right mouse is used for selection and moving the plot as described above.
One can zoom the range multiple times. The Previous range takes one back one range, while the Next range takes one forward. Each save range is in a circular buffer so when there is on next or previous range, one wraps around to the other end of the buffer.

The settings menu
With the Canvas menu item, one can adjust the default size, plot matrix, and other attributes. The canvas setting panel is shown below.
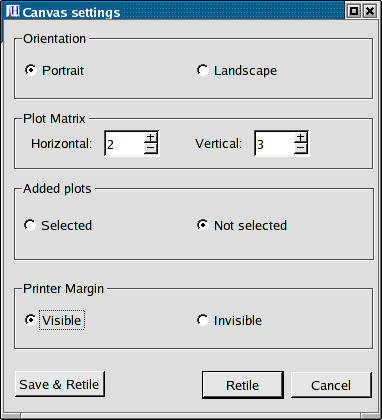
The canvas settings dialog
The first box sets whether the plots are lay outed in portrait or landscape mode. The Plot Matrix box sets how may plots are displayed horizontally and vertically for each page. The Added plots radio buttons control whether newly added plots from should be selected or not. If selected, the canvas scrolls to make the selected plot visible. The Printer Margin box set whether the printer margin is display on the screen or not.
The Save & Retile button will save the settings and rearrange the plots on the current canvas for the new settings if necessary The Retile button retiles the current canvas but does not changing the save settings. The Cancel button will close the dialog without making any changes.
Under Unix like systems, such as Linux, the settings are saved in the .qt/hippodrawrc if of the user's home directory. Under Windows, the settings are saved in the Windows Registry.
With the Printer menu item, one can configure the printer settings. With this release, only the page size and orientation is save. The Fonts menu item sets the font that is used for the plots. With this release, this font is used for titles and axis labels. In a future release, one will be able to set the font of these separately.
 1.4.3
1.4.3