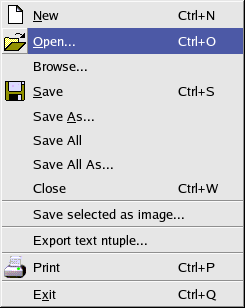
The file menu
The left hand window is the Canvas Window Users Guide upon which plots will be drawn. The right hand, smaller window is called the Inspector. One uses the Inspector Users Guide to create and modify plots in the canvas window.
An DataSource file can be imported using the file menu. If the file is in the ASCII file format for NTuple used by HippoDraw, click on the Import text ntuple menu item. If HippoDraw was configued with ROOT support, then the Import ROOT ntuple menu it is also available.
To read a ROOT file, click on the File menu at the upper left of the canvas window and select Import ROOT ntuple. as shown below
The file menu
A file browser should appear. A short cut to using the mouse to find the file is to typle at least part of the path to the file and hitting enter as show below.
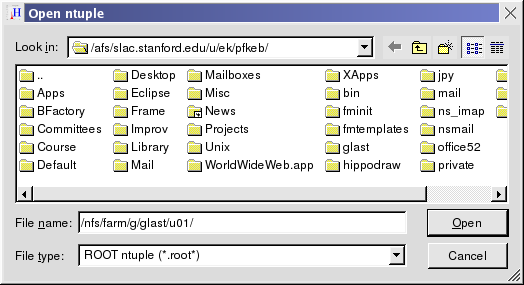
The file browser.
Then double click on the folder icons the remainer of the path until one finds the file as shown below.
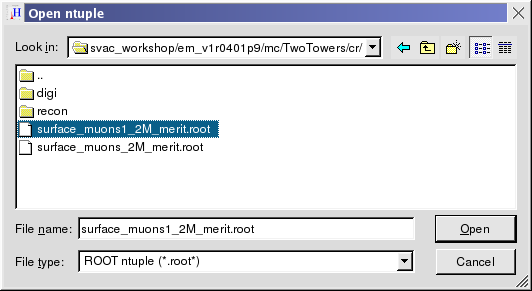
The file browser with the file.
Then one can double click on the file name or click the Open button.
The following might appear in your shell window where you stared the application.
>>> Warning: environment variable ROOTSYS is not set. Standard include files ignored
Error: cannot open file "bool.h"  FILE: LINE:0
Well its true, you don't have to set shell environment ROOTSYS when reading ROOT files with HippoDraw. If seeing this message annoyes you, set your ROOTSYS environment variable to anything and it will go away.
At this point, the Inspector will be showing you in its NTuple name box the name of the file and the name of the ROOT TTree that is ready to use.
To create a histogram, choose the variable you want to histogram from the X: combo box, then click on the New plot button.
At this point, the lower box of the Inspector shows status of currently selected plot as shown below
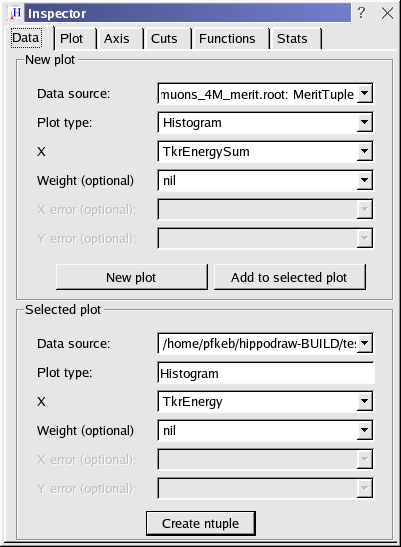
The Inspector showing selected plot.
You can modify it from there. For example, try putting the mouse cursor over the X: combo box and without clicking use the scroll wheel on the mouse. The histogram should change to the next variable in the ROOT file. Of course you can click on the combo box as well.
After changing the Y axis to a log scale in this example, the canvas window should appear like shown below.
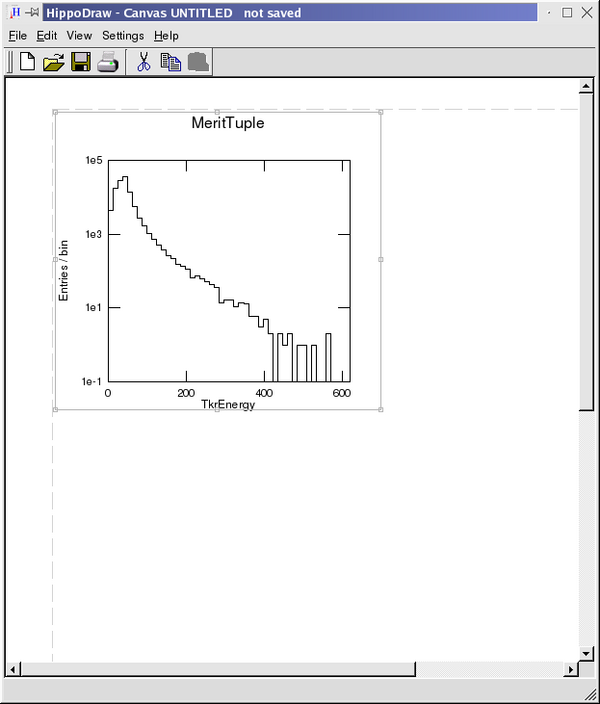
The canvas window with a plot.
For details on using the canvas window, see Canvas Window Users Guide.
For use of HippoDraw from Python, see hippo Python extension module..
 1.4.3
1.4.3