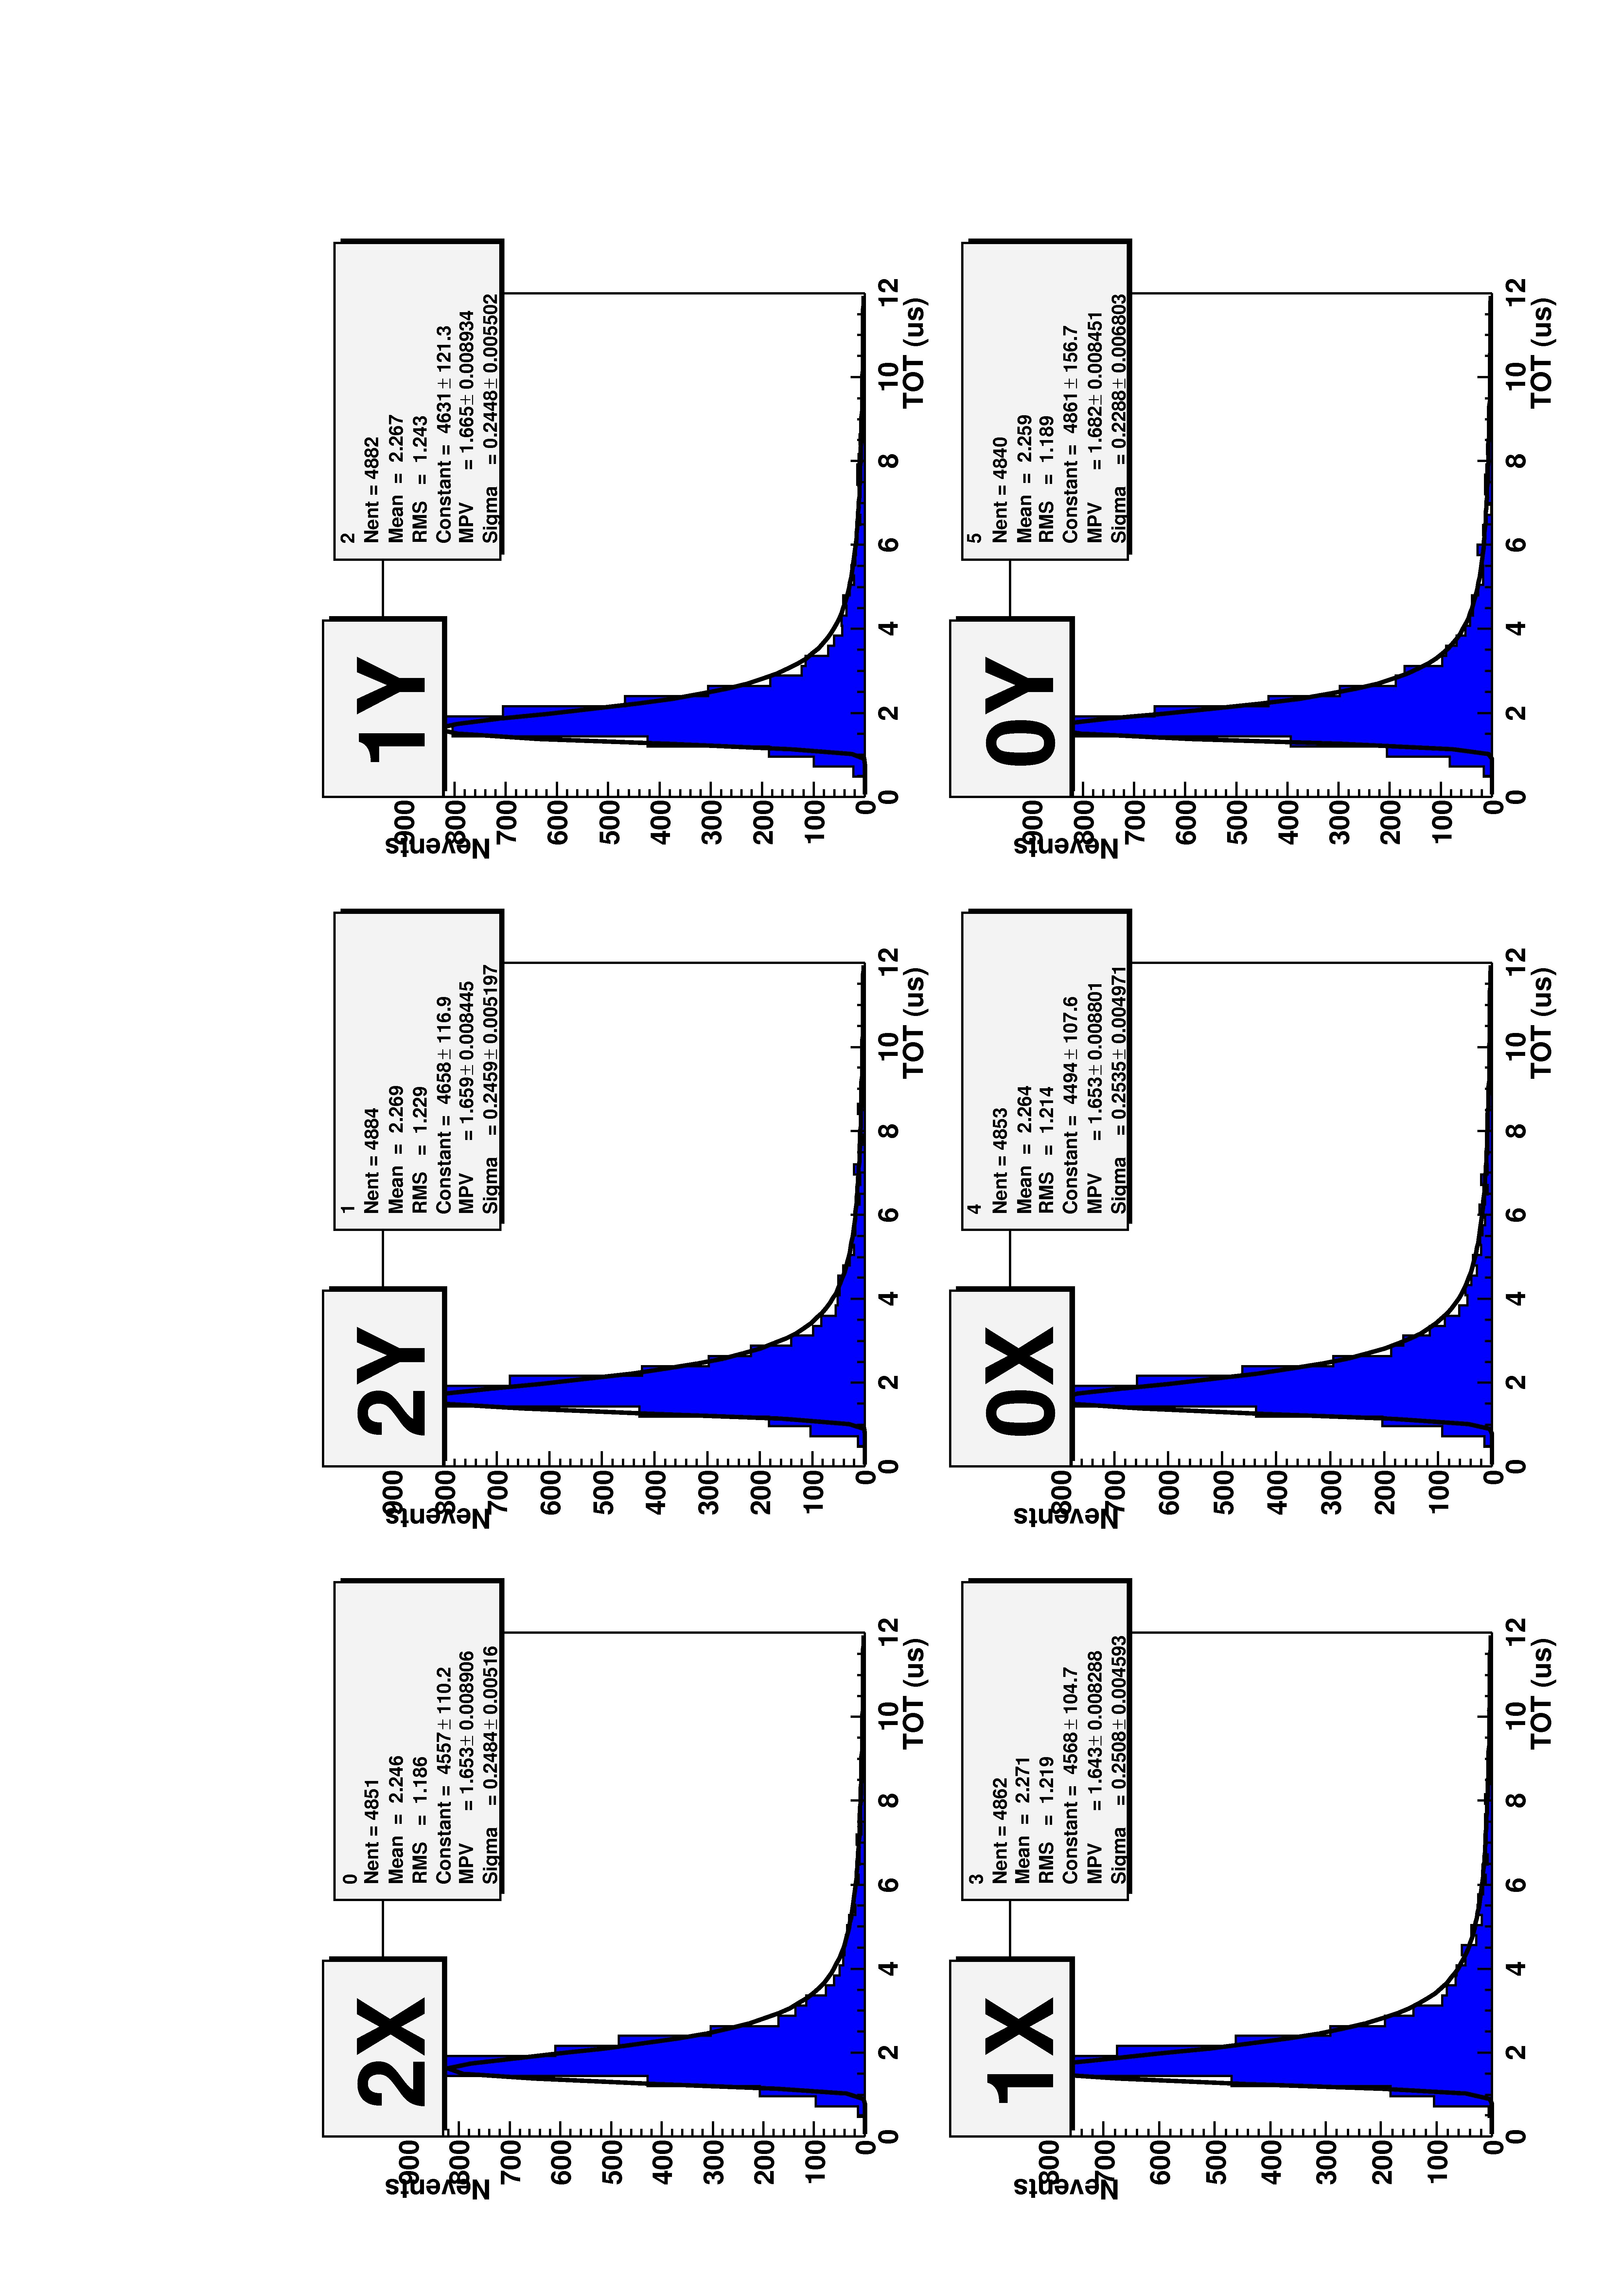
Calibration Time over Threshold distribution
ID: C13 in LAT-MD-00446-04
Description: Time response of GTRC chip from input charge from a minimum ionizing particle.
Software required: SAS
Algorithm: Select at least 1000 events containing on axis ( < 5 deg with respect to LAT Z axis) single-track muons and histogram the time distribution for every TKR layer where time is converted from counts to microseconds. Fit distributions with a Landau curve and record the most probable and the fitted sigma values.
Output data format:
|
|
Tower |
Layer |
View |
Most probable value (ms) |
Sigma (ms) |
|
|
0 |
0-2 |
0-1 * |
0-100 |
0-100 |
|
Type |
int |
Int |
int |
float |
float |
* View 0 (1) is defined as a the measured X (Y) coordinate.
Output ASCII file: c13em.txt
Root Macro: c13em.c
Python script: non applicable
Example of output distributions: c13em.jpeg
Notes: The correct conversion factor from counts to nanoseconds was not used. New value will be implemented whenever available.