S. Digel
Last updated: 03/21/2005 12:25:27 AM
gtorbsim was used to generate a DC1-type step-rocking scanning observation with a duration just slightly longer than 30 days. (The extra 2 minutes at the end will permit glbary to process data from any time range within the first 30 days.) Having 30 days' worth of data will permit useful benchmarking for DC2-type analyses
Here are the contents of the gtorbsim.par parameter file:
outfile_prefix,s,a,"/nfs/slac/g/glast/users/glground/digel/orbit/FT2_checkout2",
,,"Prefix for output files"
pointing_strategy,s,a,"ONEPERORBIT",NONE|UPDOWN|SLEWING|ONEPERORBIT|EXPLICIT|POI
NT,,"Pointing strategy"
#
# non-pointing parameter
#
rocking_angle,r,a,35,0,90,"Rocking angle (degrees)"
#
# pointing mode parameters
#
ra,r,a,0,0,360,"RA of z-axis for pointing (J2000 degrees)"
dec,r,a,0,0,360,"Dec of z-axis for pointing (J2000 degrees)"
simulation_time,r,a,2592060,1,4e7,"Simulation time (seconds)"
start_time,r,hl,0,,,"Simulation start time (seconds)"
max_numrows,i,hl,200000,,,"Maximum number of rows in FITS files"
chatter,        i, h, 2, 0, 4, "Output verbosity"
clobber,        b, h, yes, , , "Overwrite existing output files"
debug,          b, h, no, , , "Activate debugging mode"
mode,           s, h, "ql", , , "Mode of automatic parameters"
gtobssim was used with a source model that is described in detail below. In order to use the pre-built ScienceTools on the SLAC Linux system but still provide my own pulsar time profiles for PulsarSpectrum, I needed to redefine the PULSARROOT environment variable to point to a directory that I own.
The TEST response functions were used. These are DC1-era, but are better suited for convolutions in the science tools (in particular likelihood) than the DC1 response functions.
Here are the contents of the gtobssim.par parameter file:
xml_source_file,f,a,"source_model_comb.xml",,,"File of flux-style source definit
ions"
source_list,fr,a,"source_names.dat",,,"File containing list of source names"
scfile,f,a,"/nfs/slac/g/glast/users/glground/digel/orbit/FT2_checkout2_scData_00
00.fits",,,"Pointing history file"
outfile_prefix,s,a,"/nfs/slac/g/glast/users/glground/digel/checkout2/events",,,"
Prefix for output files"
simulation_time,r,a,2592000,1,4e7,"Simulation time (seconds)"
start_time,r,h,0,,,Simulation start time (seconds)
use_as_numevents,b,h,no,,,Use simulation time as number of events
max_simulation_time,r,h,3.155e8,,,Maximum simulation time (seconds)
use_acceptance_cone,b,a,no,,,"Apply acceptance cone?"
ra,r,a,0,-360,360,"RA of cone center (degrees)"
dec,r,a,0,-90,90,"Dec of cone center (degrees)"
radius,r,a,20,0,180,"Acceptance cone radius (degrees)"
emin,r,h,20,20,2e5,Minimum event energy (MeV)
emax,r,h,2e5,20,2e5,Maximum event energy (MeV)
rspfunc,s,a,"TEST",DC1|DC1F|DC1B|G25|G25F|G25B|TEST|TESTF|TESTB,,"Response funct
ions"
max_effarea,r,h,1.20,,,Maximum effective area value
max_numrows,i,h,200000,,,Maximum number of rows in FITS files
random_seed,i,a,34621,,,"Random number seed"
chatter,        i, h, 2, 0, 4, "Output verbosity"
clobber,        b, h, yes, , , "Overwrite existing output files"
debug,          b, h, no, , , "Activate debugging mode"
mode,           s, h, "ql", , , "Mode of automatic parameters"
The source model is source_model_comb.xml.
The model includes all of the non-spurious 3EG sources except for the solar flare. The fluxes were the same as used for DC1.
Blazars Four of the known blazars in the 3EG catalog were replaced with SpectralTransient sources: 3C 273, PKS 0458-020, PKS 0528+134, PKS 1622-297. Their average fluxes were left at their 3EG catalog values, or somewhat greater, and their correct redshifts were included in the parameter list for SpectralTransient. The light curves are artificial (of course). They were selected as some of the most dramatic in a set of 1212 synthetic light curves calculated by Julie McEnery. The file of light curves (lc.fits) is a parameter for SpectralTransient and is available here. Inspection of histograms of event times for runs of gtobssim with just these blazars suggests that the sources are flaring as expected.
In addition to the 3EG sources, I included 512 isotropically distributed faint (i.e., below the EGRET flux limit) blazars in the source model. These may be identical to the faint blazars that were included in the DC1 data. They have average photon spectral index 2.4, fluxes in the range (2−5) × 10-8 cm-2 s-1 (>100 MeV), and a Stecker & Salamon log N-log S distribution. In terms of equivalent isotropic intensity, they amount to less than 10% of the EGRET isotropic background.
Pulsars Five of the known pulsar sources in the 3EG catalog were replaced with PulsarSpectrum sources: Crab, Geminga, Vela, PSR B1055-52, and PSR B1706-44. For these, the timing parameters in Massimiliano Razzano's PulsarDataList.txt file were used. For the Crab, Geminga, and Vela pulsars, I specified time profiles that I read from the plots in Fierro et al. (1999). For the latter two pulsars, I used completely artificial light curves, the same for each one. These files are available here.
I intend to construct an ephemeris file using pulsarDb for the timing parameters of these pulsars, but have not done it yet. In fact, I have not yet personally verified that the light curves are reproduced in the data, owing to a misunderstanding on my part about the definition of 'epoch' in the prompts of pulsePhase.
GRBs I used the GRBmanager source to generate a GRB every 80,000 s on axis. Indications are that bursts are indeed present in the simulated data. I have not tried to analyze them quantitatively yet, however.
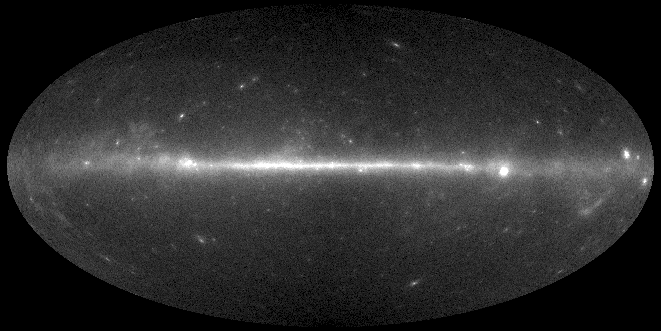
Interstellar Diffuse Emission The diffuse emission of the Milky Way was modeled as a MapCube source (a FITS 'cube' of intensities vs. energy and direction on the sky) using the gamma-ray intensity maps from a recent version of GALPROP. The cube is fairly large (about 30 Mbyte) as used, and I need to figure out how to distribute it. Also, I haven't attempted yet to use it (or possibly a sleeker version) as a MapCube source for likelihood analysis.
The GALPROP intensity map has some artifacts that are fairly obvious, especially in the longitude ranges of the Galactic center and anticenter. These are being addressed for DC2. These artifacts should not affect using the model for analysis (because the model is effectively perfect for the simulated data set), although it will be interesting to analyze the data using the EGRET team's diffuse emission model (Hunter et al. 1997), as was done for DC1.
Extragalactic Isotropic Emission This was included at a somewhat reduced intensity from Sreekumar et al. (1998), owing to the isotropically-distributed blazars described above. The net intensity is 1.376 × 10⁻⁵ cm-2 s-1 sr-1 (>100 MeV). Strong et al. (2004) have derived a somewhat lower isotropic intensity from the EGRET data. The value used here therefore should be considered conservative.