Last updated: 09/07/2005 12:15:37 AM
The pointing history was generated by Julie McEnery using a realistic orbit and attitude profile for a circular, 565 km orbit. The pointing history covers an entire 56.6-day precession period for the orbit. For technical reasons, the first entry is 900 s into the mission. Note that the MJDREF in the file is 54101., corresponding to January 1, 2007. We recognize that this is not the official MJDREF for the mission (January 1, 2001); the choice of MJDREF will not affect the science analyses. The file also includes the 'in SAA' flag (calculated for a realistic perimeter of the SAA, derived by Rob Cameron, and the 28.5 deg nominal inclination of the orbit). The time lost to SAA passages is approximately 13%. In the pointing history, a deadtime of 10% is also assumed owing to the background trigger rate. The net observing time fraction is approximately 0.9×0.87 ~ 0.78.
The DC1A response functions were used. These are DC1-era, but are better suited for convolutions in the science tools (in particular likelihood) than the DC1 response functions.
The sky model is in several XML files and supporting FITS and ASCII files. Almost all of the files that you will need to run the sky model yourself in gtobssim, should you want to, are here. For the pulsar sources, you will need to collect their light curves and the PulsarDataList file from here, and put them in their proper locations in the Pulsar package for your installation; see the details linked to the Pulsars description below.
You may find the file checkout3_srcIds.dat useful; it contains the mapping between source name and the MC_SRC_ID column of the event files. None of the science tools use this information, of course, but you can use it to verify results from the tools or to filter the data in ways that would otherwise not be possible.
Blazars 105 flaring blazars are included in the sky model. All are assigned positions and fluxes consistent with EGRET 3EG sources. The light curves are artificial (of course).
In addition to the flaring blazars, 512 isotropically distributed faint (i.e., below the EGRET flux limit), steady blazars were included in the source model. These may be identical to the faint blazars that were included in the DC1 data. In terms of equivalent isotropic intensity, they amount to less than 10% of the EGRET isotropic background.
Pulsars Six EGRET pulsars, with ephemerides, spectral, and light curves consistent with the EGRET observations, were included, along with 8 phony (and fainter) pulsars that are coincident with unidentified EGRET sources.
An ephemeris file from gtpulsardb for the timing parameters of these pulsars is available. This is useful, e.g., for gtpphase and gtpsearch. Note that you must edit the parameter files of these tools to change the hidden parameter psrdbfile to point to this ephemeris file; you won't be happy if you leave the value as 'DEFAULT'.
Other 3EG For completeness, the 148 real (not known to be spurious), non-solar flare 3EG sources not already accounted for above were included at their 3EG positions and with their 3EG fluxes (or possibly somewhat less). The XML definition file is included with the others, described above.
GRBs 48 bursts were simulated and 12 of these resulted in more than 5 LAT gamma rays. Simulated GBM data for the bursts that the LAT did detect gamma rays from are also available from the GSSC.
Dark Matter A single dark matter halo clump was simulated by Ping Wang and Larry Wai for a 100 GeV WIMP. (From Ping Wang) The photon flux from neutralino annihilation in the galactic halo is based on the paper N. Fornengo, L. Pieri, S. Scopel, Physical Review D, vol. 70, Issue 10, id. 103529. The density profile of dark matter halo is based on the paper J.F.Navarro, et al, Astrophys.J.,490,493 (1997). The parameters of the halo is based on the paper V.R.Eke, J.F.Navarro, M.Steinmetz, Astrophys.J.,554,114 (2001). The clump was placed at (l, b) = (280°, -50°) and the flux scaled to 3 × 10⁻⁸ cm-2 s-1 (>100 MeV). The source is provided as a MapCube input file (a FITS 'cube' of intensities vs. energy and direction on the sky), which is also suitable for use in a likelihood source model.
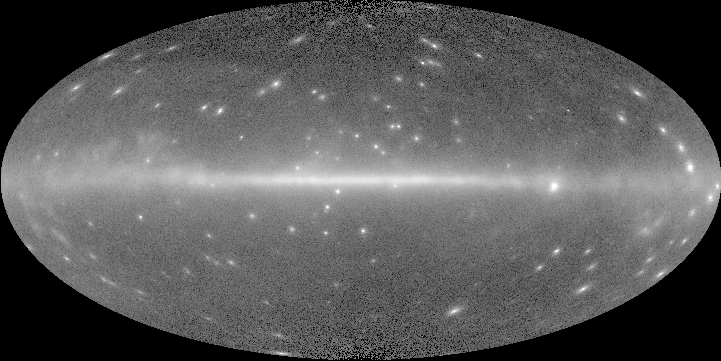
Interstellar Diffuse Emission The diffuse emission of the Milky Way was modeled as a MapCube source using the gamma-ray intensity maps from a recent version of GALPROP (Strong, Moskalenko, & Reimer 2004); this is the same as used for Checkout 2.
The GALPROP intensity map has some artifacts that are fairly obvious, especially in the longitude ranges of the Galactic center and anticenter. These are being addressed for DC2. These artifacts should not affect using the model for analysis (because the model is effectively perfect for the simulated data set), although it will be interesting to analyze the data using the EGRET team's diffuse emission model (Hunter et al. 1997), as was done for DC1.
Extragalactic Isotropic Emission This is included at a somewhat reduced intensity from Sreekumar et al. (1998), owing to the isotropically-distributed blazars described above. The net intensity is 1.376 × 10⁻⁵ cm-2 s-1 sr-1 (>100 MeV). Strong et al. (2004) have derived a somewhat lower isotropic intensity from the EGRET data. The value used here therefore should be considered conservative.