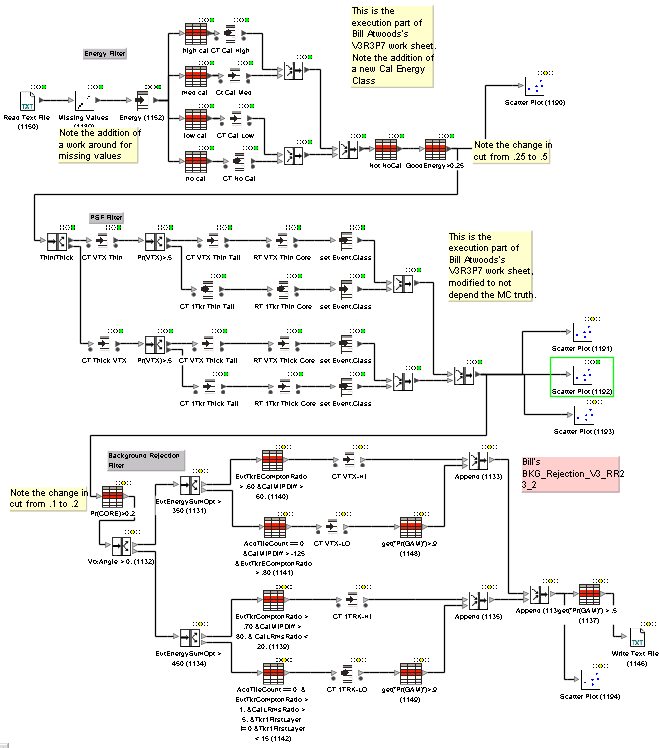
The above was generated by Bill Atwood and sent to T. Burnett on 11 Nov 2003, file name "1_multipart_xF8FF_2_V3R3P7_Complete_Analysis.imw"
Except that there are 5 scatter plots to added to compare values computed by merit (v6r14p1) with the CT and RT's.
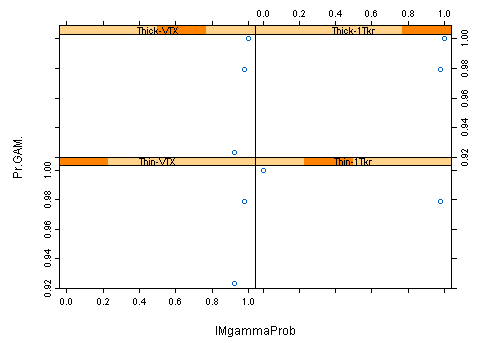
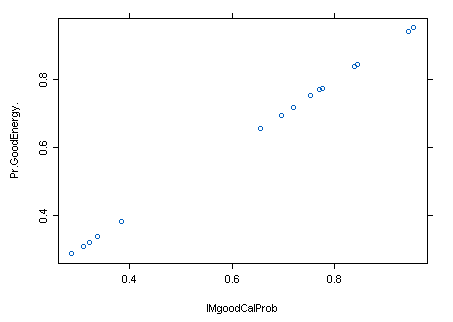
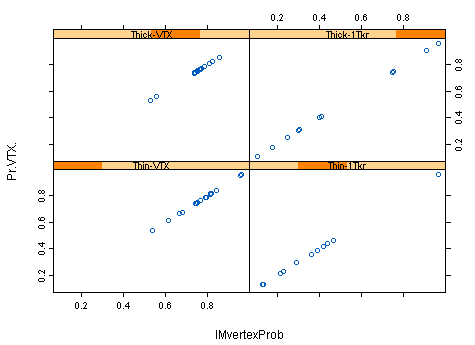
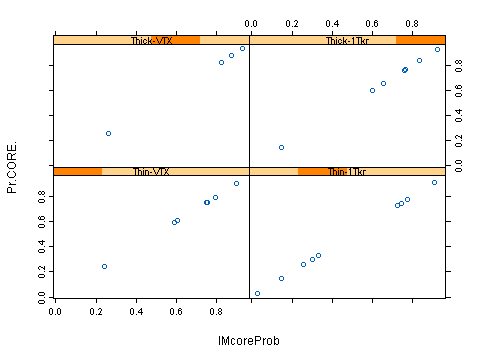
The results, for the test_Gleam run of 1000 normal 100-MeV gammas follow:
 |
 |
 |
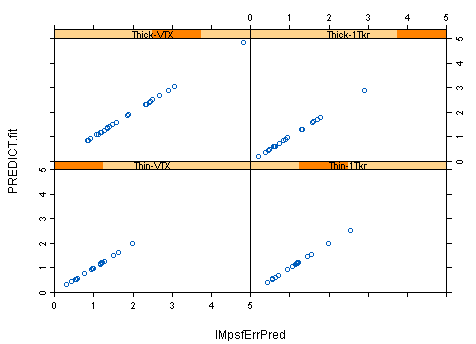 |
These plots represent the PSF optimization classifications.
The last section is a gamma/background selection, 4 separate trees computing the gamma probability: