What is Merit?
-
Takes as input the ntuple of reconstructed events (ie output of pdrApp)
-
Applies a series of cuts designed to weed out the bad stuff and improve resolution
-
Level 1-3 trigger selection cuts
-
Various background cuts
-
Cuts designed to improve resolution
-
etc.
-
-
Bins the results according to section (Front/Back), energy and incoming angle
-
Outputs the "final" answer - resolution and effective area in bins of energy and angle for Front/Back
-
Example here
What is the problem?
-
Merit is not really a analysis/development package...
-
Currently, cuts are developed outside of Merit and then plugged in once they are deemed to work.
-
Requires two versions of the same thing
-
Does not easily allow multiple developers...
Why incorporate into root?
-
Allow cut developer to "see" what they are doing
What does "incorporate into root" mean?
-
Run Merit from the root command line
-
Execute Merit cuts for a particular event to determine if event passes or fails
-
Useful for applying current cuts when developing a new one
-
-
"Easily" produce plots in root display windows
Where does it stand?
-
Merit integration into root not as easy as at first thought
-
Base objects must inherit from TObject
-
To make accessible to CINT, all higher objects need to get entered into the "dictionary" which was only successful after much hand editing of the results of dorootcint
-
root does not play well with the standard template library (at link time)
-
Recovery of objects from folders does not work quite the way expected
-
Is it me, or do the root people reinvent everything?
-
etc.
-
-
Current highly hacked version of merit does work. I am now trying to make "pretty" output plots for people to look at (see examples below).
-
If we really want something like this we should rewrite merit in the context of root
Some examples produced from a macro written to run on the root command line
-
A basic set of PSF plots in bins of energy for the nearly downward going gammas
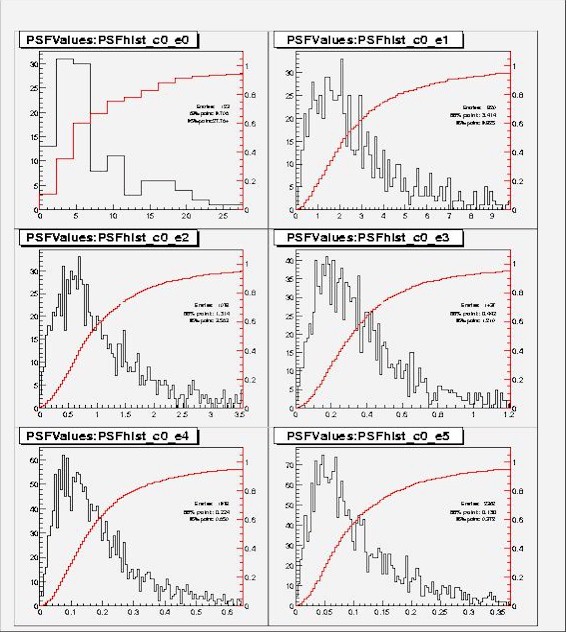
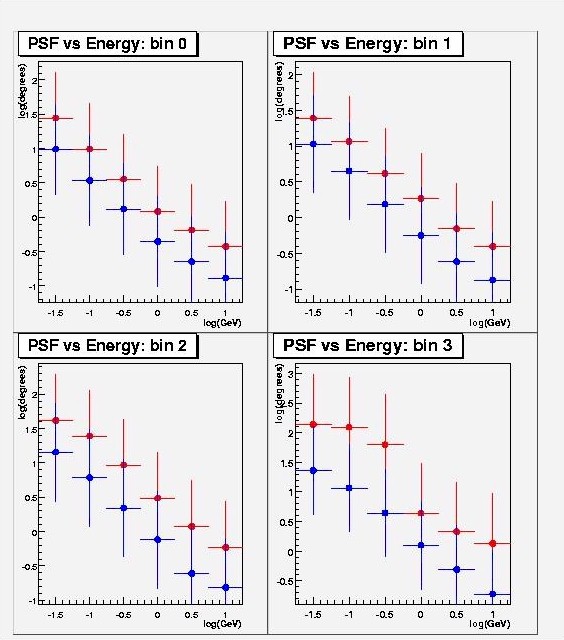
-
The summary of the PSF vs energy for the four angle bins:
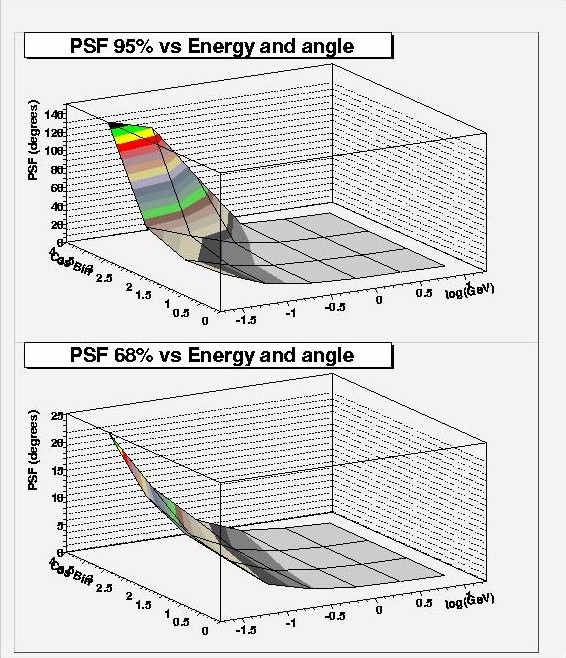
-
Here is an attempt at a surface plot: