A Comparison of Clusters in MC and Data
LSR, 19-Aug-2002
There's a long saga about a bug fix that goes with this, but that's another story. The bottom line is that the number of hit strips in a cluster was being underestimated by 1 for all but normal tracks. In the course of finding and fixing this bug, I looked into some properties of the clusters in the MC, and compared them to balloon data.
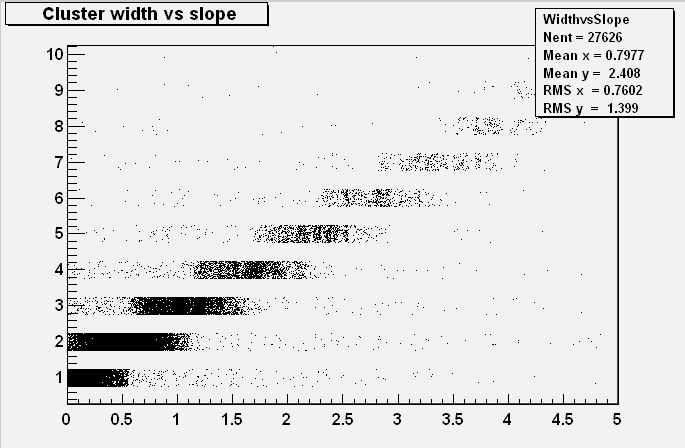
In particular, I looked at the distribution of cluster size ("length", "width") as a function of the slope of the track producing the cluster, and the offset of the cluster center from the position of the MC hit. In order to do the latter, I needed the connection between the McHits and the Clusters, in other words, a relational table. That turned out to be a bit trickier than I first thought, so I put together a poor-man's version for the purpose. In userAlg, for each cluster on a track, I looped over the McPositionHits to find the hit within a millimeter, and produced the following plots (I used downward-going 1 GeV muons, uniformly distributed between 0.1 and 1 in cos(theta)).
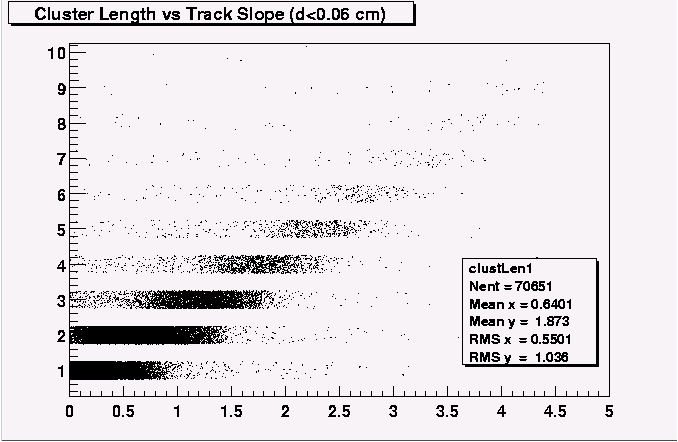
Here's the reference plot for straight tracks from the balloon flight:

and the projection of each of the cluster size distributions fit to a gaussian:
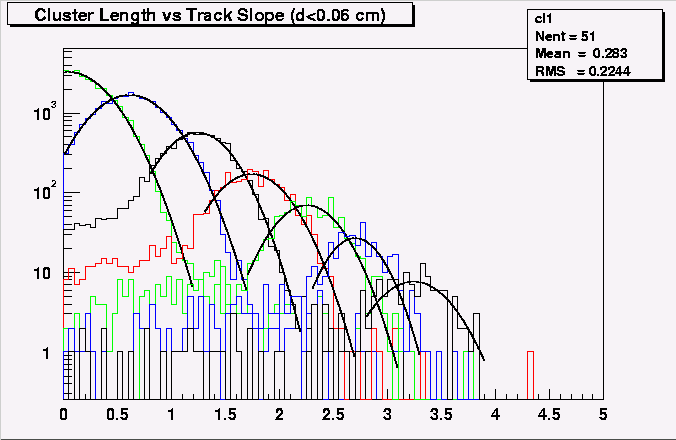
Here are the numbers for the fitted values of the peaks and widths.
| Cluster Width | Slope Fit Range | mean slope | width | delta slope |
| 1 | 0 - 1.2 | assumed zero | 0.32 | --- |
| 2 | 0 - 1.7 | 0.62 | 0.32 | 0.62 |
| 3 | 0.8 - 2.2 | 1.24 | 0.28 | 0.62 |
| 4 | 1.2 - 2.7 | 1.74 | 0.29 | 0.50 |
| 5 | 1.7 - 3.1 | 2.25 | 0.27 | 0.51 |
| 6 | 2.3 - 3.3 | 2.70 | 0.23 | 0.45 |
| 7 | 2.8 - 3.9 | 3.24 | 0.31 | 0.54 |
Leaving out the first point, the average delta slope is 0.524 (expected: 196/400 = 0.49) and the average width is 0.283
For the MC:
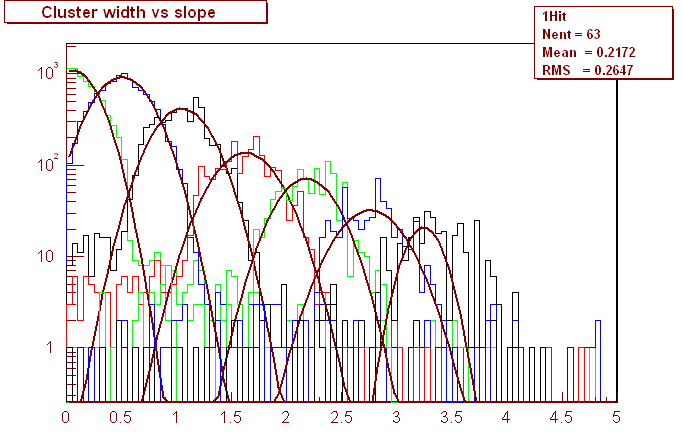
| Cluster Width | Slope Fit Range | mean slope | width | delta slope |
| 1 | 0.06 | 0.201 | --- | |
| 2 | 0.62 | 0.237 | 0.442 | |
| 3 | 1.24 | 0.235 | 0.545 | |
| 4 | 1.74 | 0.263 | 0.577 | |
| 5 | 2.25 | 0.242 | 0.556 | |
| 6 | 2.70 | 0.273 | 0.578 | |
| 7 | 3.24 | 0.158 | 0.489 |
The averages are 0.549 (expected: 228/400 = 0.57) for delta slope, and 0.234 for the width. Since these numbers scale with the strip pitch, the comparable width for the balloon would be 0.329. I think we can reasonably conclude that the MC, using TkrSimpleDigiAlg, underestimates the cluster width. Diffusion? Different particle mix and energy spectrum? Electronic effects?
Here's the plot of the offset between MC hit position and cluster position:
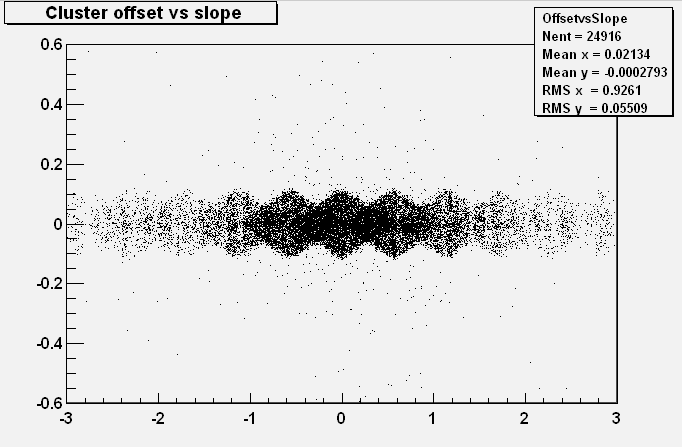
We can see the effect that Bill was describing: at certain values of the slope, the position of the cluster is measured better than at others. It will be interesting to see what diffusion does to this picture.