Main Page   File List  

DC1 Analysis of the Third EGRET Catalog

Introduction

There are 271 point sources in the Third EGRET Catalog (see also), including one Solar Flare. Knowing that the 20 MeV to 1 TeV extrapolation of the 3EG catalog formed the basis for the point sources used in the DC1 data set, I decided to analyze the first day of DC1 data using the 3EG catalog as a candidate source list.

To facilitate this process, I have written a number of Python scripts to drive the Likelihood applications. These scripts are available in the catalogAnalysis subdirectory of my personal development area on the LAT CVS repository. Note that some code is re-used from my likeGui.

Defining the Regions-of-Interest

A preliminary step to performing this automated analysis is to define the regions-of-interest (ROIs) to be used by Likelihood for fitting various subsets of the source list. I defined these ROIs by hand. One could automate this part too, for example, by simply laying out a grid of over-lapping ROIs, but that would not create an optimal set. Ideally, the total number of ROIs should be as small as possible while still providing complete coverage of all the sources. For automating this step, some clustering algorithm for identifying groups of sources (e.g., Bayesian Blocks) would be helpful.

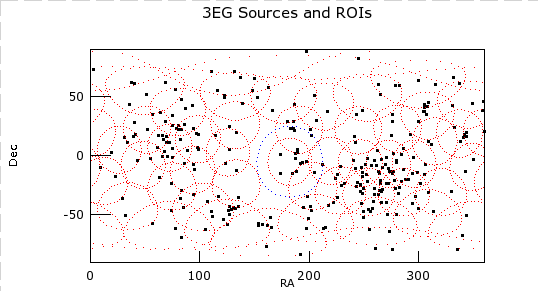
Somewhat arbitrarily, I've chosen acceptance cones with 20 degree half-opening angles for all of the ROIs. One could define the ROIs to have much larger opening angles, so that there are only a few of them, but that would mean larger numbers of events for each Likelihood fit; and there is anecdotal evidence that the run-time for these fits scales worse than , where is the number of events. I expect that there is some optimal size of a given ROI that depends both on the local sky density of events and on the local density of candidate sources.

In any case, here are the 50 ROIs that I selected by hand, picking out groups of sources by eye:

ROIs.png
The 271 3EG sources are plotted as black squares, and the outlines of the 20 degree ROI acceptance cones are plotted with small red points (note the distortions near the poles). Since the point-spread function is fairly broad a lower energies, (at least a few degrees half-width below 100 MeV), I define the source region for each ROI to have a 30 degree half opening angle. An example source region cone is plotted in blue; all sources lying within this cone are included in the source model for that fit. An isotropic component for the extragalactic diffuse and the EGRET Galactic Diffuse model are also included in each fit.

Point Source Results

The main script that steers the Likelihood tools is run_analysis.py. Briefly, this script loops through the 50 ROIs, creates an exposure map for each one using expMap (see also the makeExpMap.py driver script), reads in an ascii file of 3EG source positions, creates an xml source model file using makeSrcList.py, and then launches the Likelihood application, capturing and parsing Likelihood's fit summary that is normally output to the console.

Here is a partial table of the results

                                        DC1                       3EG
  ID      ROI   ROI dist.     flux      index       TS       flux      index     catalog ID
    0       0       1.82    8.11e-03     1.88     228.95   4.23e-03     1.85   3EG J0010+7309
    1       5      11.93    3.42e-03     2.51      35.59   1.20e-03     2.70   3EG J0038-0949
    2       4       7.05    1.89e-03     2.61      16.34   5.10e-04     2.63   3EG J0118+0248
    3       5      10.44    1.70e-03     3.40      21.07   1.16e-03     2.50   3EG J0130-1758
    4       6       7.19    2.78e-03     3.18      37.89   9.80e-04     2.89   3EG J0159-3603
    5       4      11.24    1.96e-03     2.67      10.82   8.70e-04     2.23   3EG J0204+1458
    6       6       8.50    2.00e-02     2.16     740.77   8.55e-03     1.99   3EG J0210-5055
    7       4      10.04    3.06e-03     2.22      49.66   9.30e-04     2.03   3EG J0215+1123
    8       1      14.94    7.51e-03     2.33     134.20   1.87e-03     2.01   3EG J0222+4253
    9       1       9.83    1.22e-02     2.49      56.50   3.79e-03     2.29   3EG J0229+6151
   10       3      12.88    6.09e-03     1.97     124.29   2.59e-03     1.85   3EG J0237+1635
   11       3      12.53    4.13e-03     3.25      49.75   1.38e-03     2.53   3EG J0239+2815
   12       1       8.23    1.19e-02     1.96     108.65   6.93e-03     2.21   3EG J0241+6103
   13       3      10.57    2.52e-03     2.47      17.66   8.80e-04     2.61   3EG J0245+1758
   14       9       6.13    2.84e-03     2.62      29.34   6.20e-04     2.10   3EG J0253-0345
   15       1       3.26    5.67e-03     2.23      36.74   9.70e-04     2.38   3EG J0323+5122
   16       3       0.52    4.91e-03     2.53      42.87   7.40e-04     2.61   3EG J0329+2149
   17       9       8.89    4.55e-03     2.17      90.63   1.51e-03     1.84   3EG J0340-0201
   18       3      14.14    4.96e-03     2.46      43.65   1.15e-03     2.16   3EG J0348+3510
   19       7       7.96    1.03e-03     1.87      18.49   3.80e-04     2.10   3EG J0348-5708
   20       8      11.54    3.24e-03     3.10      25.70   1.11e-03     2.65   3EG J0404+0700
and the full table.

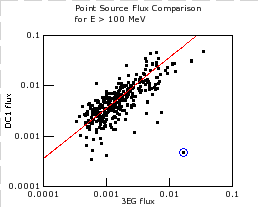
The units of flux are for both the DC1 and 3EG values. Here is a plot of the fitted DC1 flux vs 3EG flux:

flux_comparison.png
The red curve is a 45 degree line that is scaled by a factor of about 3.6. The positive correlation is encouraging, but the large multiplicative factor indicates a serious bias (or dumb mistake on my part in computing the > 100 MeV flux) in Likelihood's estimates of the DC1 fluxes, assuming that the 3EG point source fluxes were not substantially altered for generating the DC1 data. The point circled in blue corresponds to the June 6, 1991 Solar Flare, which was excised from the DC1 source list and for which, fortunately, Likelihood does not find a substantial flux.

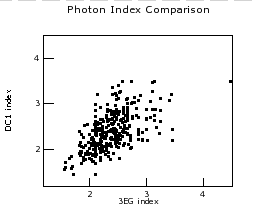
A comparison of the spectral indices for these DC1 fits versus the 3EG values is more reassuring:

index_comparison.png
There is no strong evidence of bias here, and a histogram of the ratio of spectral indices is centered nicely about unity,

index_ratio_hist.png
although some more stringent statistical tests should be applied to these data.

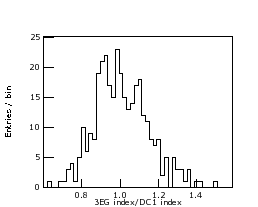
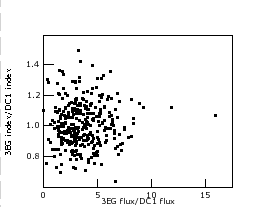
Finally, here is a scatter plot of DC1/3EG index ratio versus flux ratio for which no obvious correlation is seen:

flux_index_scatterplot.png

Diffuse Emission

As I noted, all of the source models include extragalactic and Galactic diffuse emission components. It is instructive to look at the diffuse model parameters obtained from those 50 fits. Since Likelihood tends to find systematically harder spectral indices for the diffuse emission components than what is input to the simulations, I've fixed the power-law photon spectral indices of both components to their nominal values (2.1 for both), leaving the two normalizations free to vary in the fits.

Here are plots of these normalizations as a function of Galactic latitude:

EGDiffuse.png
GalDiffuse.png
From the EGRET analysis of the extragalactic diffuse emission, the value of the power-law function Prefactor should be 1.32 (in units of 
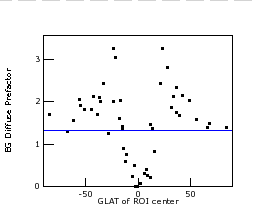
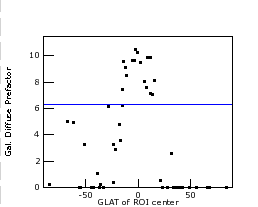
), and for the Galactic diffuse emission, the power-law Prefactor should be 6.31. Those values are indicated by the blue horizontal lines in the respective plots.

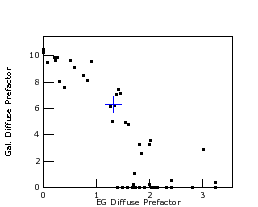
At high Galactic latitude, where the Galactic diffuse emission makes only a very small contribution, the extragalactic Prefactor has fitted values that roughly agree with the nominal value of 1.32. In regions where the Galactic diffuse emission is more important, i.e., at lower Galactic latitudes, the relative normalization between the two diffuse components is strongly anti-correlated. This occurs because within a relatively small region of interest (and for a relatively small number of events), there is insufficient structure in the Galactic diffuse emission to distinguish it from an isotropic component. Plotting the two Prefactors against each other, the anti-correlation is clear:

EG_Gal.png
The blue cross shows the location of the nominal values of both prefactors. That it lies on the main sequence of anti-correlated values indicates that the overall normalizations of these diffuse components are probably being fit correctly...assuming that the DC1 data were generated using the nominal values.
Generated on Tue Nov 1 08:07:21 2005 by doxygen1.3-rc3