#include <QtCut.h>
Inheritance diagram for QtCut:
It locks the QApplication object before forwarding messages to the contained CutDisplay object. It unlocks the QApplication object upon return.
Definition at line 29 of file QtCut.h.
Public Member Functions | |
| void | addDataRep (PyFunctionRep *pyFuncRep) |
| Adds a Function (as PyFunctionRep). | |
| void | addDataRep (PyDataRep *pyRep) |
| Adds a DataRep created within Python. | |
| void | addDataRep (const std::string &type, const DataSource *ntuple, const std::vector< std::string > &bindings) |
| Creates and adds a DataRep to the display. | |
| void | addDataRepStacked (const std::string &type, const DataSource *ntuple, const std::vector< std::string > &bindings) |
| Adds a DataRep to the display by stacking, i.e. | |
| void | addFunction (FunctionBase *function) |
| Adds a Function (as a FunctionBase object). | |
| void | addObserver (hippodraw::Observer *observer) |
| Adds an observer to PlotterBase object. | |
| void | addTarget (QtDisplay *) |
| Adds a display as a target of the cut. | |
| void | addTargets (const std::vector< QtDisplay * > &targets) |
| Adds the displays as targets of the cut. | |
| void | addValues (const std::vector< double > &v) |
| Adds the values to the display. | |
| PyDataSource * | createDataArray () const |
| Creates a data array wrapper for the contents of the display. | |
| NTuple * | createNTuple () const |
| Creates and returns an NTuple representing the display. | |
| int | currentView () |
| Return the current view index. | |
| std::vector< double > | cutRange () |
| Return the range of the cut. | |
| void | deleteView (int index) |
| Delete a view by index. | |
| PlotterBase * | display () |
| Returns the wrapped display object. | |
| double | getBinWidth (const std::string &axis) const |
| Returns the bin width on the specified axis. | |
| PyDataRep * | getDataRep () |
| Returns the selected DataRep in the plotter. | |
| const std::vector< PyDataRep * > & | getDataReps () const |
| Returns a vector of all DataReps in the plotter. | |
| const std::string & | getLabel (const std::string &axis) const |
| Returns the label on the specified axis. | |
| int | getLog (const std::string &axis) |
| Return 1 if the specified axis is logrithmically scaled. | |
| std::vector< double > | getRange (const std::string &axis) |
| Get the Range of the specified axis. | |
| const std::string & | getTitle () const |
| Returns the title of the display. | |
| int | nextView (bool stepForward=true) |
| Cycle through each set of plot ranges, thereby changing the view with each call. | |
| double | numberOfEntries () const |
| Return the number of entries in the display. | |
| int | numViews () |
| Return the number of stored views. | |
| int | plotterId () const |
| Return the Id to the plotter object. | |
| QtCut (PlotterBase *plotter) | |
| Create a cut object from a Cut[1/2]DPlotter object. | |
| QtCut (const PyDataSource &nt, const std::vector< std::string > &binding, QtDisplay *target, double low, double high) | |
| Constructor for creating a CutPlotter with axis binding to PyDataSource nt, applying the TupleCut to target, and setting the range to low and high. | |
| QtCut (const DataSource &nt, const std::vector< std::string > &binding, QtDisplay *target, double low, double high) | |
| Constructor for creating a CutPlotter with axis binding to DataSource nt, applying the TupleCut to target, and setting the range to low and high. | |
| QtCut (const PyDataSource &nt, const std::vector< std::string > &binding) | |
| Create a cut. | |
| QtCut (const DataSource &nt, const std::vector< std::string > &binding) | |
| Create a cut. | |
| void | reset () |
| Resets all bins. | |
| void | resize () |
| Restore the X and Y dimensions of the display to their saved values. | |
| int | saveView () |
| Save the current set of plot ranges which define a "view" for this plot. | |
| void | setAspectRatio (double ratio) |
| Sets the aspect ratio. | |
| void | setAutoRanging (const std::string &axis, bool flag) |
| Sets the auto ranging flag on specified axis. | |
| void | setAutoTicks (const std::string &axis, bool yes) |
| Sets the ticks to be automatic or manual. | |
| void | setBinWidth (const std::string &axis, double width) |
| Sets the bin width on the specified axis. | |
| void | setBinWidth (const std::string &axis, double width, bool save=false) |
| Sets the bin width on the specified axis. | |
| void | setColorMap (const std::string &name) |
| Set the color map by name. | |
| void | setContourLevels (const std::vector< double > &levels) |
| Set the contour levels if a ContourPointRep. | |
| void | setCutRange (double low, double high, const std::string &axis="x") |
| Sets the range of the cut on the chosen axis. | |
| void | setEnabled (bool yes) |
| Sets the enabled status. | |
| void | setLabel (const std::string &axis, const std::string &label) |
| Sets the label on the corresponding axis. | |
| void | setLog (const std::string &axis, int flag) |
| Sets the specified axis to Logrithmic binning (if applicable ) and display. | |
| void | setNumberOfBins (const std::string &axis, unsigned int number) |
| Sets the number of bins. | |
| void | setOffset (const std::string &axis, double offset) |
| Sets the offset of the bins on the specified axis. | |
| void | setPointRep (RepBase *rep) |
| Sets the PointRep for the display. | |
| void | setRange (const std::string &axis, double low, double high) |
| Sets the Range on the specified axis. | |
| void | setRange (const std::string &axis, double low, double high, bool save=false) |
| Sets the Range on the specified axis. | |
| void | setTicks (const std::string &axis, const std::vector< double > &values, const std::vector< std::string > &labels) |
| Sets the axis ticks to specified points and values. | |
| void | setTitle (const std::string &title) |
| Sets the title of the display. | |
| void | setTransform (const std::string &name) |
| Sets the Transform. | |
| void | setView (int index) |
| Set the view by index. | |
| void | toggleInverted () |
| Toggles the inversion status. | |
| void | unlock () |
| Unlock the QApplication in case of exception. | |
| void | update () |
| Updates the display. | |
Protected Attributes | |
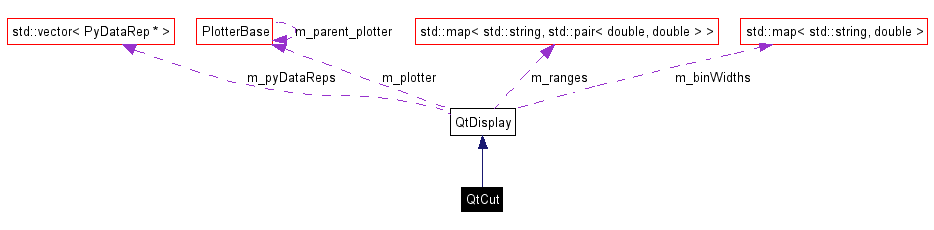
| PlotterBase * | m_plotter |
| The contained PlotterBase object. | |
Private Member Functions | |
| void | createCut (const DataSource &ds, const std::vector< std::string > &binding) |
| Creates an uninitialized cut. | |
|
||||||||||||
|
Create a cut.
Definition at line 143 of file QtCut.cxx. References createCut(). |
|
||||||||||||
|
Create a cut.
Definition at line 151 of file QtCut.cxx. References createCut(), and PyDataSource::dataSource(). |
|
||||||||||||||||||||||||
|
Constructor for creating a CutPlotter with axis binding to DataSource nt, applying the TupleCut to target, and setting the range to low and high.
Definition at line 119 of file QtCut.cxx. References addTarget(), createCut(), and setCutRange(). |
|
||||||||||||||||||||||||
|
Constructor for creating a CutPlotter with axis binding to PyDataSource nt, applying the TupleCut to target, and setting the range to low and high.
Definition at line 131 of file QtCut.cxx. References addTarget(), createCut(), PyDataSource::dataSource(), and setCutRange(). |
|
|
Create a cut object from a Cut[1/2]DPlotter object. If the plotter is neither then an assert is raised. Definition at line 158 of file QtCut.cxx. References QtDisplay::m_plotter. |
|
|
Adds a Function (as PyFunctionRep).
Definition at line 725 of file QtDisplay.cxx. References DisplayController::addDataRep(), PyFunctionRep::getRep(), DisplayController::instance(), and QtDisplay::m_plotter. |
|
|
Adds a DataRep created within Python.
Definition at line 715 of file QtDisplay.cxx. References DisplayController::addDataRep(), PyDataRep::getDataRep(), DisplayController::instance(), and QtDisplay::m_plotter. |
|
||||||||||||||||
|
Creates and adds a DataRep to the display.
Definition at line 689 of file QtDisplay.cxx. References DisplayController::addDataRep(), DisplayController::instance(), and QtDisplay::m_plotter. Referenced by hippodraw::Python::export_QtDisplay(). |
|
||||||||||||||||
|
Adds a DataRep to the display by stacking, i.e. sharing X axis but not the Y axis. Definition at line 703 of file QtDisplay.cxx. References DisplayController::addDataRepStacked(), DisplayController::instance(), and QtDisplay::m_plotter. Referenced by hippodraw::Python::export_QtDisplay(). |
|
|
Adds a Function (as a FunctionBase object).
Definition at line 737 of file QtDisplay.cxx. References DisplayController::addDataRep(), FunctionController::createFunctionRep(), PlotterBase::getDataRep(), DisplayController::instance(), FunctionController::instance(), and QtDisplay::m_plotter. Referenced by hippodraw::Python::export_QtDisplay(). |
|
|
Adds an observer to PlotterBase object.
Definition at line 1160 of file QtDisplay.cxx. References QtDisplay::m_plotter. Referenced by hippodraw::Python::export_QtDisplay(). |
|
|
Adds a display as a target of the cut.
Definition at line 167 of file QtCut.cxx. References QtDisplay::display(), CutController::instance(), and QtDisplay::m_plotter. Referenced by hippodraw::Python::export_QtCut(), and QtCut(). |
|
|
Adds the displays as targets of the cut.
Definition at line 177 of file QtCut.cxx. References QtDisplay::display(), CutController::instance(), QtDisplay::m_plotter, and num_util::size(). Referenced by hippodraw::Python::export_QtCut(). |
|
|
Adds the values to the display.
Definition at line 1040 of file QtDisplay.cxx. References QtDisplay::m_plotter, and QtDisplay::unlock(). Referenced by hippodraw::Python::export_QtDisplay(). |
|
||||||||||||
|
Creates an uninitialized cut.
Definition at line 111 of file QtCut.cxx. References CutController::instance(), and QtDisplay::m_plotter. Referenced by QtCut(). |
|
|
Creates a data array wrapper for the contents of the display.
Definition at line 1189 of file QtDisplay.cxx. References QtDisplay::createNTuple(), FunctionController::instance(), QtDisplay::m_plotter, and QtDisplay::unlock(). Referenced by hippodraw::Python::export_QtDisplay(). |
|
|
Creates and returns an NTuple representing the display.
Definition at line 1049 of file QtDisplay.cxx. References FunctionController::instance(), QtDisplay::m_plotter, and QtDisplay::unlock(). Referenced by QtDisplay::createDataArray(), and hippodraw::Python::export_QtDisplay(). |
|
|
Return the current view index.
Definition at line 841 of file QtDisplay.cxx. References PlotterBase::currentView(), and QtDisplay::m_plotter. Referenced by hippodraw::Python::export_QtDisplay(). |
|
|
Return the range of the cut. For a 1 D cutplotter the range is returned as [Xlow, Xhi] while for a 2 D cutplotter the range is returned as [Xlow, Xhi, Ylow, Yhi] Definition at line 207 of file QtCut.cxx. References QtDisplay::getRange(), Range::high(), Range::low(), and QtDisplay::m_plotter. Referenced by hippodraw::Python::export_QtCut(). |
|
|
Delete a view by index.
Definition at line 830 of file QtDisplay.cxx. References PlotterBase::deleteView(), and QtDisplay::m_plotter. Referenced by hippodraw::Python::export_QtDisplay(). |
|
|
Returns the wrapped display object.
Definition at line 680 of file QtDisplay.cxx. References QtDisplay::m_plotter. Referenced by PyCanvas::addDisplay(), addTarget(), addTargets(), PyCanvas::addText(), PyCanvas::addTextAt(), PyFunctionRep::addTo(), PyCanvas::findSelectedView(), and PyCanvas::removeDisplay(). |
|
|
Returns the bin width on the specified axis.
Definition at line 942 of file QtDisplay.cxx. References PlotterBase::getBinWidth(), and QtDisplay::m_plotter. Referenced by hippodraw::Python::export_QtDisplay(). |
|
|
Returns the selected DataRep in the plotter.
Definition at line 1011 of file QtDisplay.cxx. References PlotterBase::activePlotIndex(), PlotterBase::getDataRep(), and QtDisplay::m_plotter. Referenced by hippodraw::Python::export_QtDisplay(). |
|
|
Returns a vector of all DataReps in the plotter.
Definition at line 1021 of file QtDisplay.cxx. References PlotterBase::getDataRep(), PlotterBase::getNumDataReps(), QtDisplay::m_plotter, and QtDisplay::m_pyDataReps. Referenced by hippodraw::Python::export_QtDisplay(). |
|
|
Returns the label on the specified axis.
Definition at line 902 of file QtDisplay.cxx. References hippodraw::Axes::convert(), and QtDisplay::m_plotter. Referenced by hippodraw::Python::export_QtDisplay(). |
|
|
Return 1 if the specified axis is logrithmically scaled.
Definition at line 993 of file QtDisplay.cxx. References DisplayController::getLog(), DisplayController::instance(), and QtDisplay::m_plotter. Referenced by hippodraw::Python::export_QtDisplay(). |
|
|
Get the Range of the specified axis.
Definition at line 775 of file QtDisplay.cxx. References hippodraw::Axes::convert(), PlotterBase::getRange(), Range::high(), Range::low(), QtDisplay::m_plotter, and num_util::type(). Referenced by cutRange(), hippodraw::Python::export_QtDisplay(), and QtDisplay::saveView(). |
|
|
Returns the title of the display.
Definition at line 852 of file QtDisplay.cxx. References PlotterBase::getTitle(), and QtDisplay::m_plotter. Referenced by hippodraw::Python::export_QtDisplay(). |
|
|
Cycle through each set of plot ranges, thereby changing the view with each call.
Definition at line 813 of file QtDisplay.cxx. References QtDisplay::m_plotter, and PlotterBase::nextView(). Referenced by hippodraw::Python::export_QtDisplay(). |
|
|
Return the number of entries in the display.
Definition at line 1062 of file QtDisplay.cxx. References PlotterBase::activeProjector(), ProjectorBase::getNumberOfEntries(), and QtDisplay::m_plotter. Referenced by hippodraw::Python::export_QtDisplay(). |
|
|
Return the number of stored views.
Definition at line 826 of file QtDisplay.cxx. References QtDisplay::m_plotter, and PlotterBase::numViews(). Referenced by hippodraw::Python::export_QtDisplay(). |
|
|
Return the Id to the plotter object.
Definition at line 1117 of file QtDisplay.cxx. References QtDisplay::m_plotter, and PlotterBase::plotterId(). Referenced by hippodraw::Python::export_QtDisplay(). |
|
|
Resets all bins.
Definition at line 916 of file QtDisplay.cxx. References QtDisplay::m_plotter, and QtDisplay::unlock(). Referenced by hippodraw::Python::export_QtDisplay(). |
|
|
Restore the X and Y dimensions of the display to their saved values.
Definition at line 1070 of file QtDisplay.cxx. References DisplayController::getLog(), DisplayController::instance(), QtDisplay::m_binWidths, QtDisplay::m_plotter, QtDisplay::m_ranges, PlotterBase::setAutoRanging(), PlotterBase::setBinWidth(), QtDisplay::setLog(), and PlotterBase::setRange(). Referenced by hippodraw::Python::export_QtDisplay(). |
|
|
Save the current set of plot ranges which define a "view" for this plot.
Definition at line 785 of file QtDisplay.cxx. References QtDisplay::getRange(), QtDisplay::m_plotter, QtDisplay::m_ranges, std::make_pair(), and PlotterBase::saveView(). Referenced by hippodraw::Python::export_QtDisplay(). |
|
|
Sets the aspect ratio.
Definition at line 1033 of file QtDisplay.cxx. References QtDisplay::m_plotter, and PlotterBase::setAspectRatio(). Referenced by hippodraw::Python::export_QtDisplay(). |
|
||||||||||||
|
Sets the auto ranging flag on specified axis.
Definition at line 1003 of file QtDisplay.cxx. References hippodraw::Axes::convert(), QtDisplay::m_plotter, PlotterBase::setAutoRanging(), and num_util::type(). Referenced by hippodraw::Python::export_QtDisplay(). |
|
||||||||||||
|
Sets the ticks to be automatic or manual.
Definition at line 1178 of file QtDisplay.cxx. References QtDisplay::m_plotter, and QtDisplay::unlock(). Referenced by hippodraw::Python::export_QtDisplay(). |
|
||||||||||||
|
Sets the bin width on the specified axis. This version is needed since Boost.Python cannot accommodate default arguments directly. Definition at line 947 of file QtDisplay.cxx. References QtDisplay::setBinWidth(). |
|
||||||||||||||||
|
Sets the bin width on the specified axis.
Definition at line 923 of file QtDisplay.cxx. References QtDisplay::m_binWidths, QtDisplay::m_plotter, and PlotterBase::setBinWidth(). Referenced by hippodraw::Python::export_QtDisplay(), and QtDisplay::setBinWidth(). |
|
|
Set the color map by name.
Definition at line 1126 of file QtDisplay.cxx. References std::find(), BinToColorFactory::instance(), and QtDisplay::m_plotter. Referenced by hippodraw::Python::export_QtDisplay(). |
|
|
Set the contour levels if a ContourPointRep.
Definition at line 872 of file QtDisplay.cxx. References PlotterBase::activePlotIndex(), PlotterBase::getDataRep(), DataRep::getProjector(), QtDisplay::m_plotter, RepBase::name(), Observable::notifyObservers(), and PlotterBase::representation(). Referenced by hippodraw::Python::export_QtDisplay(). |
|
||||||||||||||||
|
Sets the range of the cut on the chosen axis. The choice of axis matters only when a 2D cut is being talked about Definition at line 191 of file QtCut.cxx. References hippodraw::Axes::convert(), QtDisplay::m_plotter, and num_util::type(). Referenced by hippodraw::Python::export_QtCut(), and QtCut(). |
|
|
Sets the enabled status. Sets the enabled status of the CutPlotter. A plotter that is disabled keeps its target but does not apply the cut. Definition at line 229 of file QtCut.cxx. References QtDisplay::m_plotter. Referenced by hippodraw::Python::export_QtCut(). |
|
||||||||||||
|
Sets the label on the corresponding axis.
Definition at line 893 of file QtDisplay.cxx. References hippodraw::Axes::convert(), QtDisplay::m_plotter, and PlotterBase::setLabel(). Referenced by hippodraw::Python::export_QtDisplay(). |
|
||||||||||||
|
Sets the specified axis to Logrithmic binning (if applicable ) and display.
Definition at line 982 of file QtDisplay.cxx. References hippodraw::Axes::convert(), DisplayController::instance(), QtDisplay::m_plotter, DisplayController::setLog(), and num_util::type(). Referenced by hippodraw::Python::export_QtDisplay(), and QtDisplay::resize(). |
|
||||||||||||
|
Sets the number of bins.
Definition at line 909 of file QtDisplay.cxx. References QtDisplay::m_plotter, and PlotterBase::setNumberOfBins(). Referenced by hippodraw::Python::export_QtDisplay(). |
|
||||||||||||
|
Sets the offset of the bins on the specified axis.
Definition at line 951 of file QtDisplay.cxx. References hippodraw::Axes::convert(), DisplayController::instance(), QtDisplay::m_plotter, DisplayController::setOffset(), and num_util::type(). Referenced by hippodraw::Python::export_QtDisplay(). |
|
|
Sets the PointRep for the display.
Definition at line 858 of file QtDisplay.cxx. References QtDisplay::m_plotter, and PlotterBase::setRepresentation(). Referenced by hippodraw::Python::export_QtDisplay(). |
|
||||||||||||||||
|
Sets the Range on the specified axis. This version is needed since Boost.Python cannot accommodate default arguments directly. Definition at line 770 of file QtDisplay.cxx. References QtDisplay::setRange(). |
|
||||||||||||||||||||
|
Sets the Range on the specified axis.
Definition at line 753 of file QtDisplay.cxx. References QtDisplay::m_plotter, QtDisplay::m_ranges, std::make_pair(), and PlotterBase::setRange(). Referenced by hippodraw::Python::export_QtDisplay(), and QtDisplay::setRange(). |
|
||||||||||||||||
|
Sets the axis ticks to specified points and values.
Definition at line 1167 of file QtDisplay.cxx. References QtDisplay::m_plotter, and QtDisplay::unlock(). Referenced by hippodraw::Python::export_QtDisplay(). |
|
|
Sets the title of the display.
Definition at line 845 of file QtDisplay.cxx. References QtDisplay::m_plotter, and PlotterBase::setTitle(). Referenced by hippodraw::Python::export_QtDisplay(). |
|
|
Sets the Transform.
Definition at line 961 of file QtDisplay.cxx. References DisplayController::instance(), QtDisplay::m_plotter, and DisplayController::setTransform(). Referenced by hippodraw::Python::export_QtDisplay(). |
|
|
Set the view by index.
Definition at line 801 of file QtDisplay.cxx. References QtDisplay::m_plotter, and PlotterBase::setView(). Referenced by hippodraw::Python::export_QtDisplay(). |
|
|
Toggles the inversion status.
Definition at line 239 of file QtCut.cxx. References QtDisplay::m_plotter. Referenced by hippodraw::Python::export_QtCut(). |
|
|
Unlock the QApplication in case of exception.
Definition at line 978 of file QtDisplay.cxx. Referenced by QtDisplay::addValues(), QtDisplay::createDataArray(), QtDisplay::createNTuple(), hippodraw::Python::export_QtDisplay(), QtDisplay::QtDisplay(), QtDisplay::reset(), QtDisplay::setAutoTicks(), and QtDisplay::setTicks(). |
|
|
Updates the display.
Definition at line 1149 of file QtDisplay.cxx. References QtDisplay::m_plotter. Referenced by hippodraw::Python::export_QtDisplay(). |
|
 1.4.3
1.4.3